
How Traditional Chinese Medicine treats PCOS
14/06/2021
What is the difference between dry-needling and acupuncture?
29/10/2021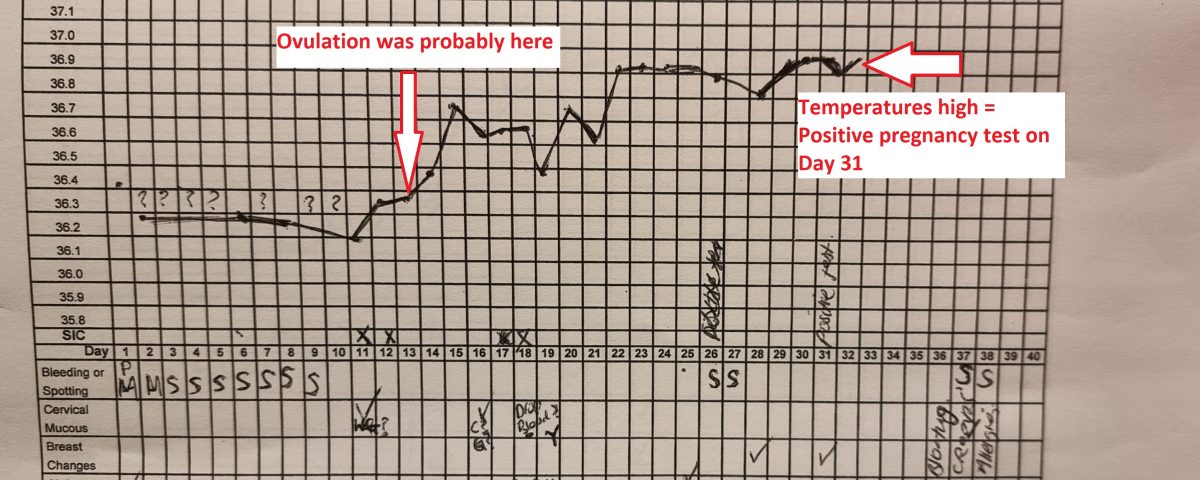
How to use a BBT chart to help you fall pregnant
We often use BBT charts for women who are trying to fall pregnant. It’s a useful tool for women who experience an irregular cycle, or for women who are not exactly sure when they ovulate, or for women who have a history of early miscarriage.
During an initial consult with us, if we feel that charting may be of benefit, we discuss all the ins and outs. Since this seems to be consistently useful information for our patients, I thought I would share all our knowledge here, so that if you can’t get to see us soon, at least you can start charting and have some info prior to coming in.
What does BBT stand for?
BBT stands for Basal Body Temperature. In other words, it is your base body temperature when you wake up first thing in the morning. (A female’s waking temperature is not necessarily 36.5 °C. Females often notice shifts and fluctuations in their temperature depending on where they are in their cycle). Your temperature should respond to hormonal changes in your cycle, specifically related to ovulation.
What you need:
Paper charts vs Phone apps
We like the no-fuss, inexpensive approach in our clinic. We give our patients good old fashioned paper charts and ask them to use these for the purposes of continuing treatment with us. Paper charts are superior to downloadable apps, because paper charts are not subjected to phone updates and therefore, you will never “lose” your data because your phone decided it needed to update. They also enable us to photocopy the charts and keep them with your records, so if we need to discuss anything over the phone, we have your chart handy on our end.
Cheap oral digital thermometers vs Specific BBT thermometers
Your temperature must be taken orally (in the mouth, under the tongue). Cheap digital thermometers work fine. There are more expensive, BBT specific thermometers on the market, but I’ve been telling women to use cheap regular thermometers for nearly 20 years and they have never failed so far. Just make sure you’ve replaced the battery if you are dusting it off from the back of the cupboard.
What to do:
Take your temperature at the same time each morning.
Take your temperature as soon as you wake, first thing, before you talk to your partner, before you go to the toilet, before you start moving around. Keep your thermometer, chart and pen by your bed. You will literally wake up, roll over, stick the thermometer in your mouth and chart your temperature. (Your temperature rises quite quickly once you start talking or moving around, for an accurate BBT temperature it’s important you don’t do these things before taking your temperature).
Your temperature is the most accurate if you’ve had relatively undisturbed sleep. It is generally the most accurate if you’ve had at least 4 hours of undisturbed sleep before taking your temperature. If you’ve had a night that has been disturbed by nighttime toileting (for example), please still take your temperature but just make a note on the chart that it was a “sleep disturbed” night. If, on reflection, we can see that the temperature was abnormally low or high the next morning, we will know to disregard that temperature as an anomaly, and put it down to the disturbed sleep.
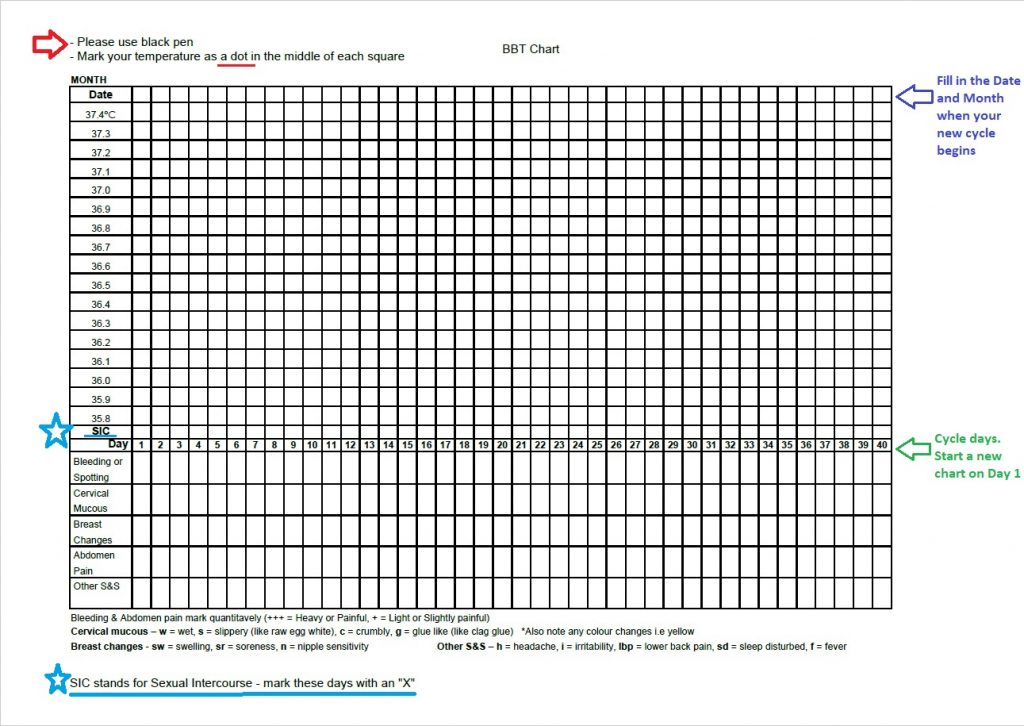
What if I sleep in? For a chart to be the most accurate, it should be taken at roughly the same time each morning. A general rule is that BBT rises by 0.1°C for every hour you’ve overslept past your normal waking time. For example, if you normally wake at 6am but you’ve slept in until 8am (2 hours overslept) you can still take your temperature, but just drop it back down by 0.2 on the actual chart (which is what it would have been if you had taken it at 6am). I’ve made this easy on my downloadable chart (below) as each little square is 0.1°C.
I tell my patients to “set and forget”. That is, take your temperature, plot it and forget about it. Don’t try and interpret anything and do not obsess over it. I have been known to ban women from charting if they are starting to obsess over it. This isn’t healthy and it’s not the purpose of charting. The purpose of charting is to try and get at least 3 charts (3 complete cycles) so we can see what your body pattern is.
It’s important to note that BBT charts are just a tool. Just like any tool, they have limitations. They give us information, but it won’t be entirely accurate, therefore they won’t be the only source of information we use to predict things like ovulation. (Just like building a house, there is not one tool that will do the whole job).
We use BBT charts to understand patterns. We are interested in looking at the overall, big picture pattern. Observing patterns can take a little time. By noticing patterns over 3 months/cycles, you gain better knowledge as to what to predict in the next/upcoming cycle.
If your chart doesn’t look like a “normal/typical” chart that’s ok. You are not meant to know what it means and you are not meant to figure it out by yourself. As a Chinese medicine practitioner I’ve found the BBT charts give me a useful insight in how to better help my patients achieve a more “normal” looking temperature chart by delicately changing the balance of herbal ingredients or dosages and change acupuncture point prescriptions at crucial times.
As we strive towards a more normal, healthy looking BBT, women find them useful because they can start to correlate the changes they notice in their temperature with the changes they notice in cervical mucous. They can look at where they are in their cycle and see what their hormones are doing by looking at their temperature chart. This then enables them to time sexual intercourse better around their fertile window to greatly increase their chances of conception.
How do I tell when I ovulated from looking at the chart?
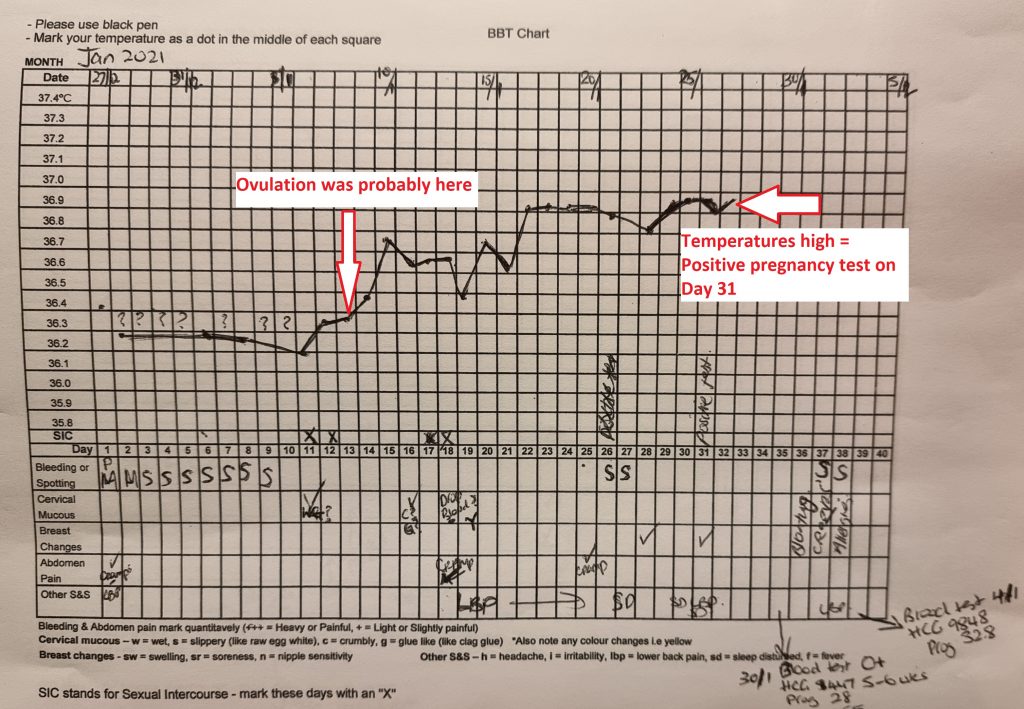
In a bi-phasic chart ovulation is clearly seen as a sharp rise of temperature in the luteal phase that stays nice and high and fairly steady. This indicates good progesterone levels, which is crucial for implantation and preventing miscarriage in the first trimester. Observing mucous changes leading up to ovulation is also wise so that you have a better understanding of what your body is doing and when it is doing it. If you are unsure about what mucous you should be looking out for, check out my fertile mucous blog post here.
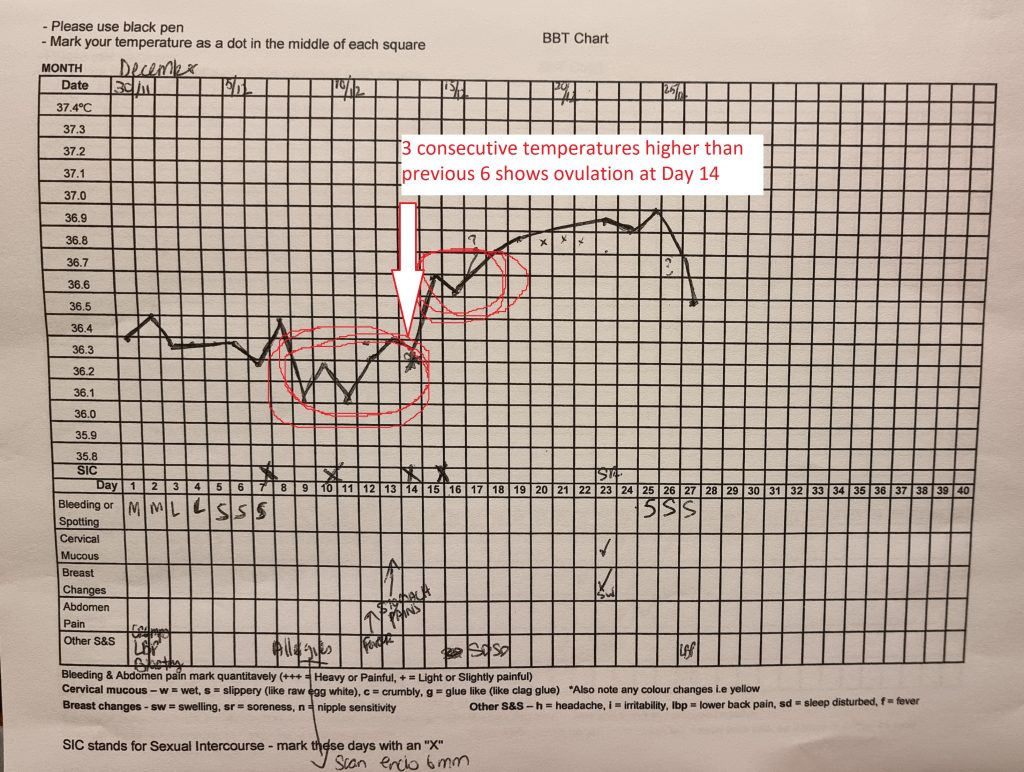
If your chart doesn’t have a clear bi-phasic pattern then looking back at when ovulation occured can be a little trickier. It can take up to 3 days after ovulation for your temperature to rise nice and high. There is a general rule that says ovulation occurred when there has been 3 consecutive higher temps than the previous 6.
When looking at the overall pattern, if we notice that ovulation isn’t really that clear/hard to discern, we adjust our treatment accordingly to encourage a better ovulation the following cycle. Similarly, any fluctuations of temperature in the luteal phase (short luteal phase, temperature dropping at implantation, luteal temps not high at all etc) can be useful information to help guide treatment (herbs and acupuncture).
Click on the downloadable pdf file below for our BBT chart we give to our patients. Please email us if it doesn’t work! info@pointspecifics.com
Thank you for reading my blog post. I hope it was helpful. I have a whole heap of other blog posts that you might find interesting.
Do you have questions?

